How to plot a sequence diagram
A Sequence object can be visualized in following two ways.
We define the sequence to be visualized first.
from qfabric import (
   DigitalPulse,
   LinearRamp,
   Sequence,
   SineSweep,
   SineWave,
   Step,
)

step = Step("sine")
step.add_analog_function(0, SineWave(100e6, 1))
step.duration = 5e-6
sequence.add_step(step)

step = Step("sweep")
step.add_analog_function(1, SineSweep(90e6, 110e6, 1, 1, 0, 1e-5))
step.add_digital_function(0, DigitalPulse(5e-6, 1e-5))
sequence.add_step(step)

step = Step("ramp")
step.add_analog_function(2, LinearRamp(-1, 1, 0, 1e-5))
step.add_digital_function(1, DigitalPulse(5e-6, 1e-5))
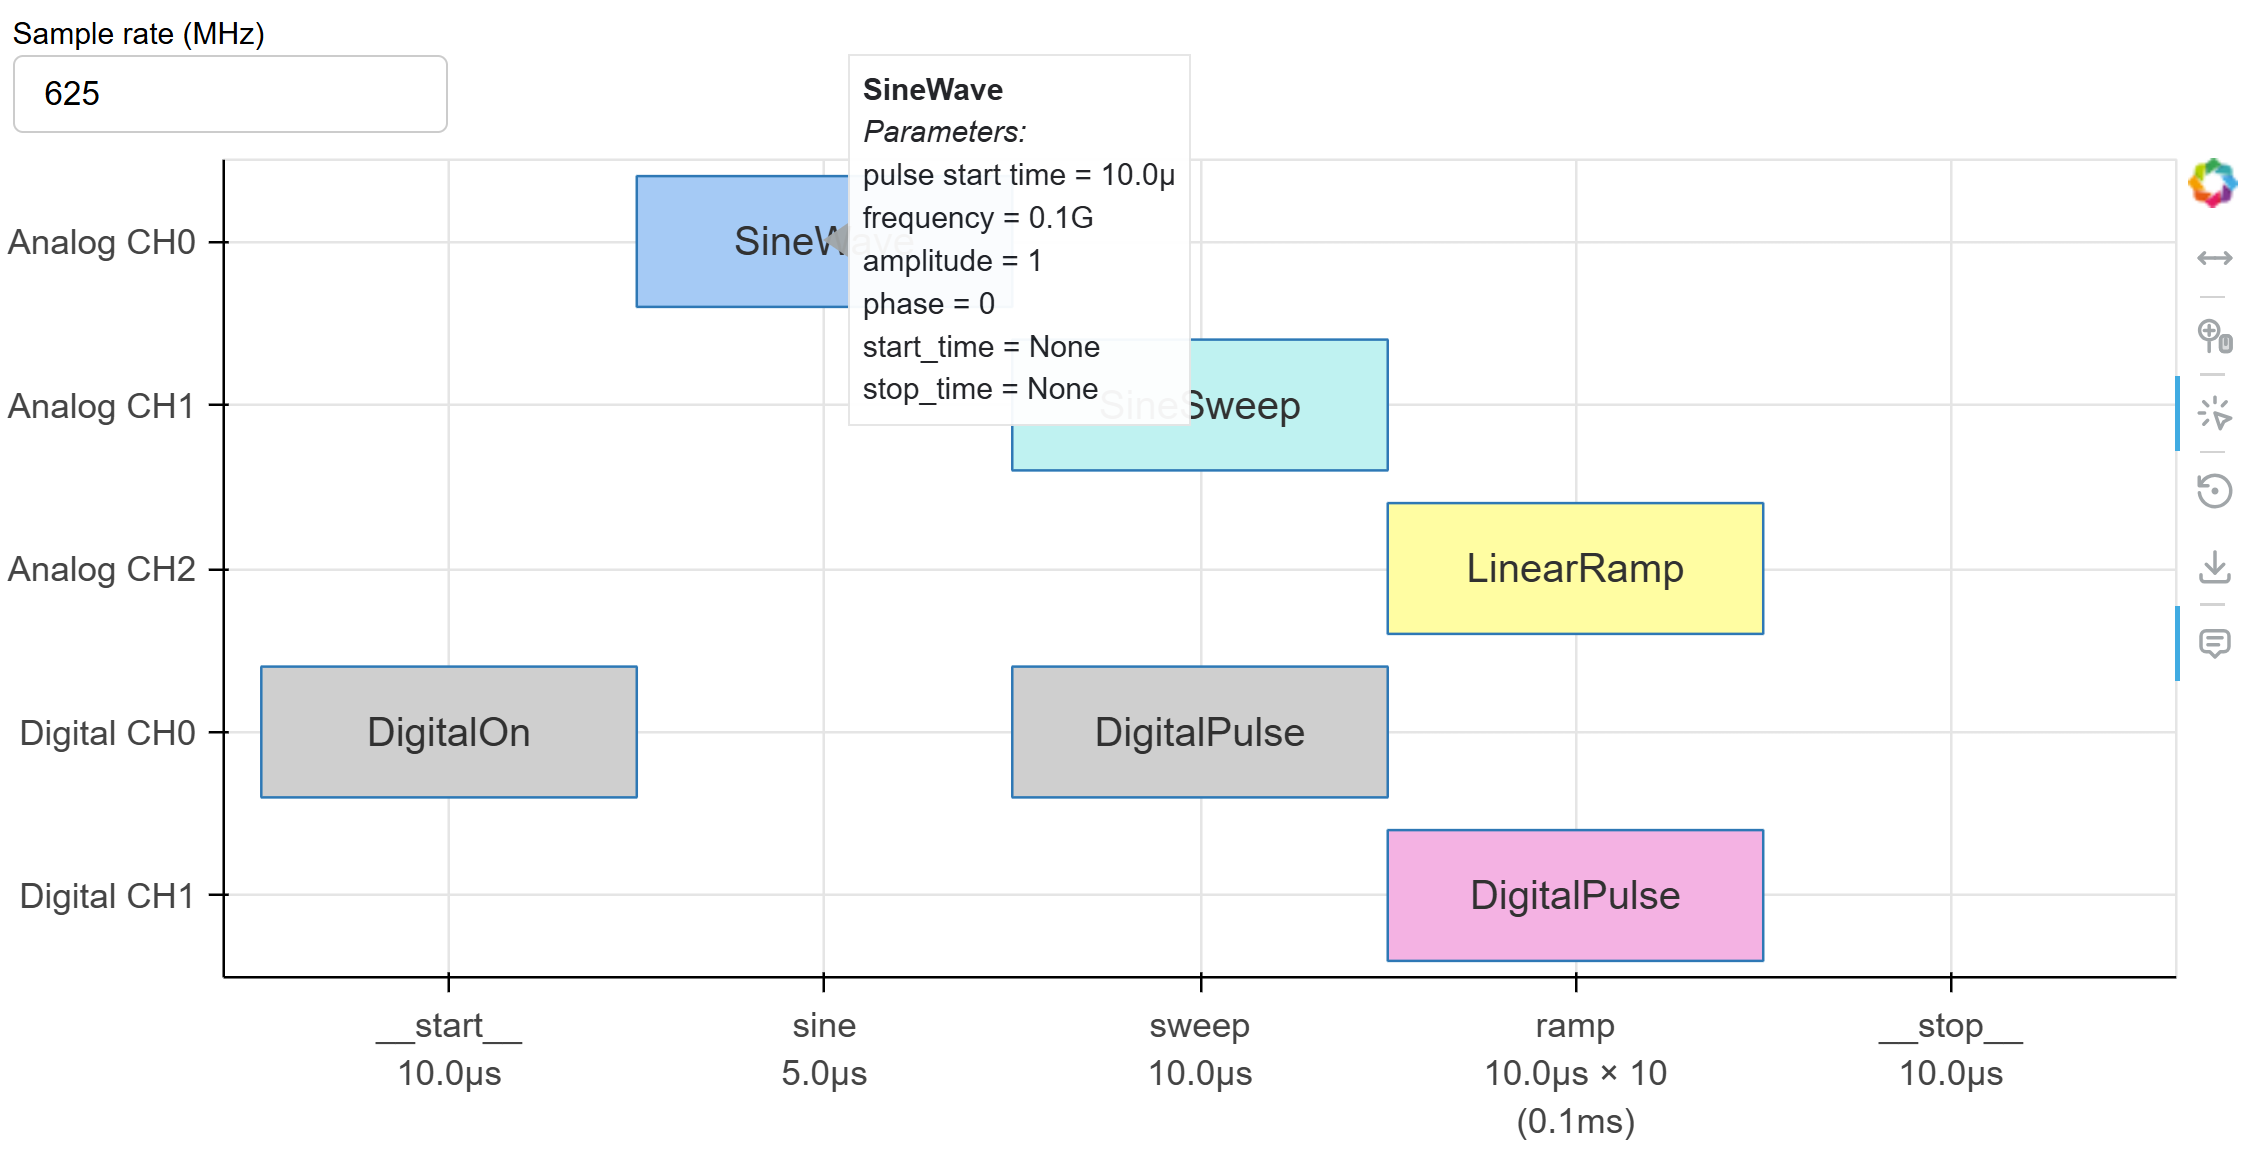
Logic view
Use logic_sequence() to view a sequence in the logic view,
where each step is depicted as equal length.
from qfabric import logic_sequence

logic_sequence(sequence)
This opens up a new browser window with the following figure:

Hovering the mouse on a function shows the fields of the function.
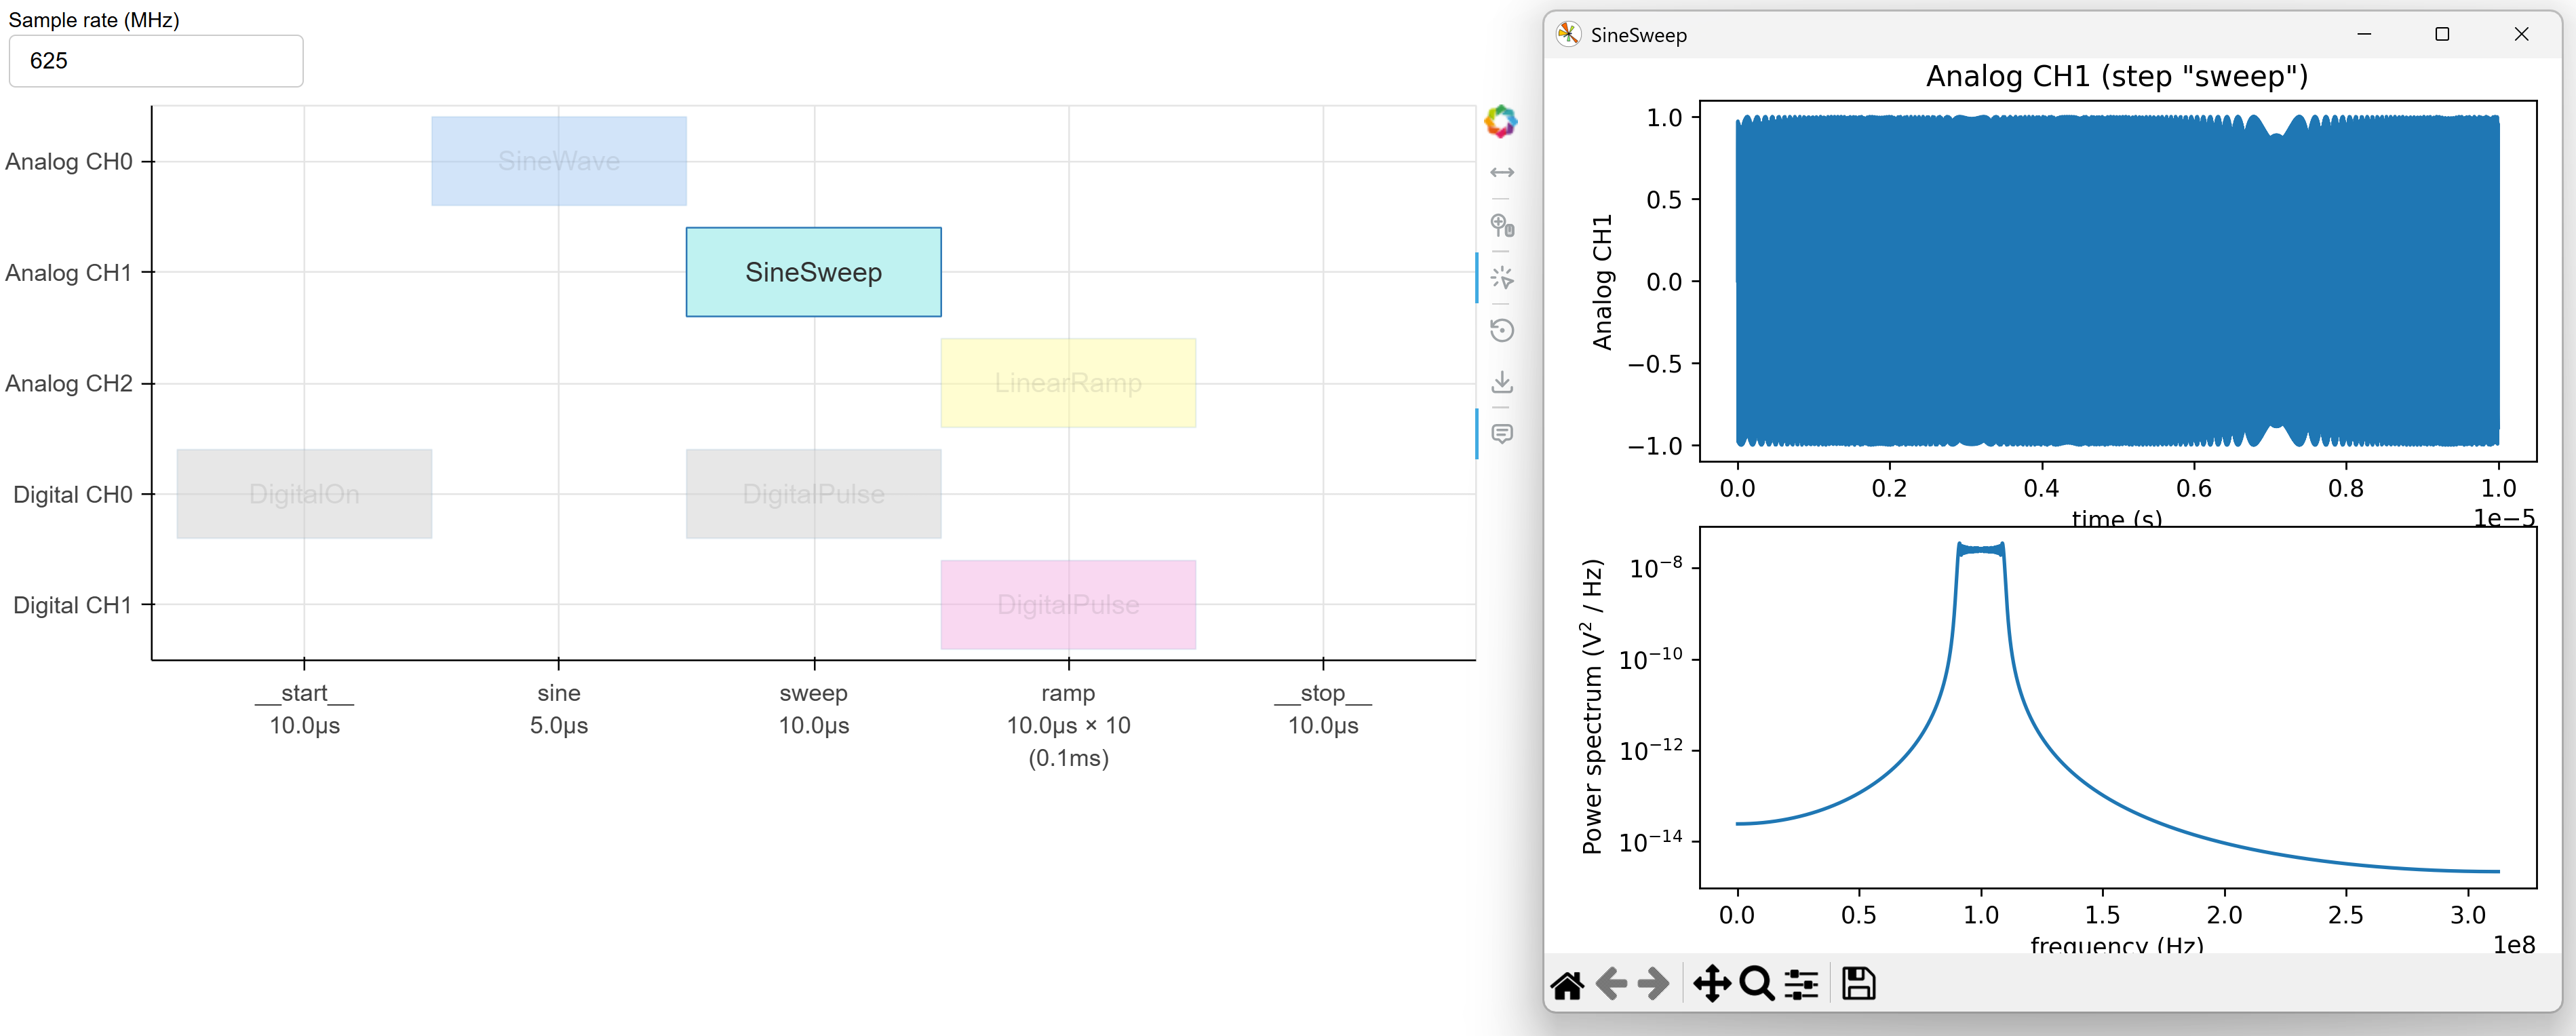
Clicking on an analog function shows its temporal trace and spectral power in a new window:
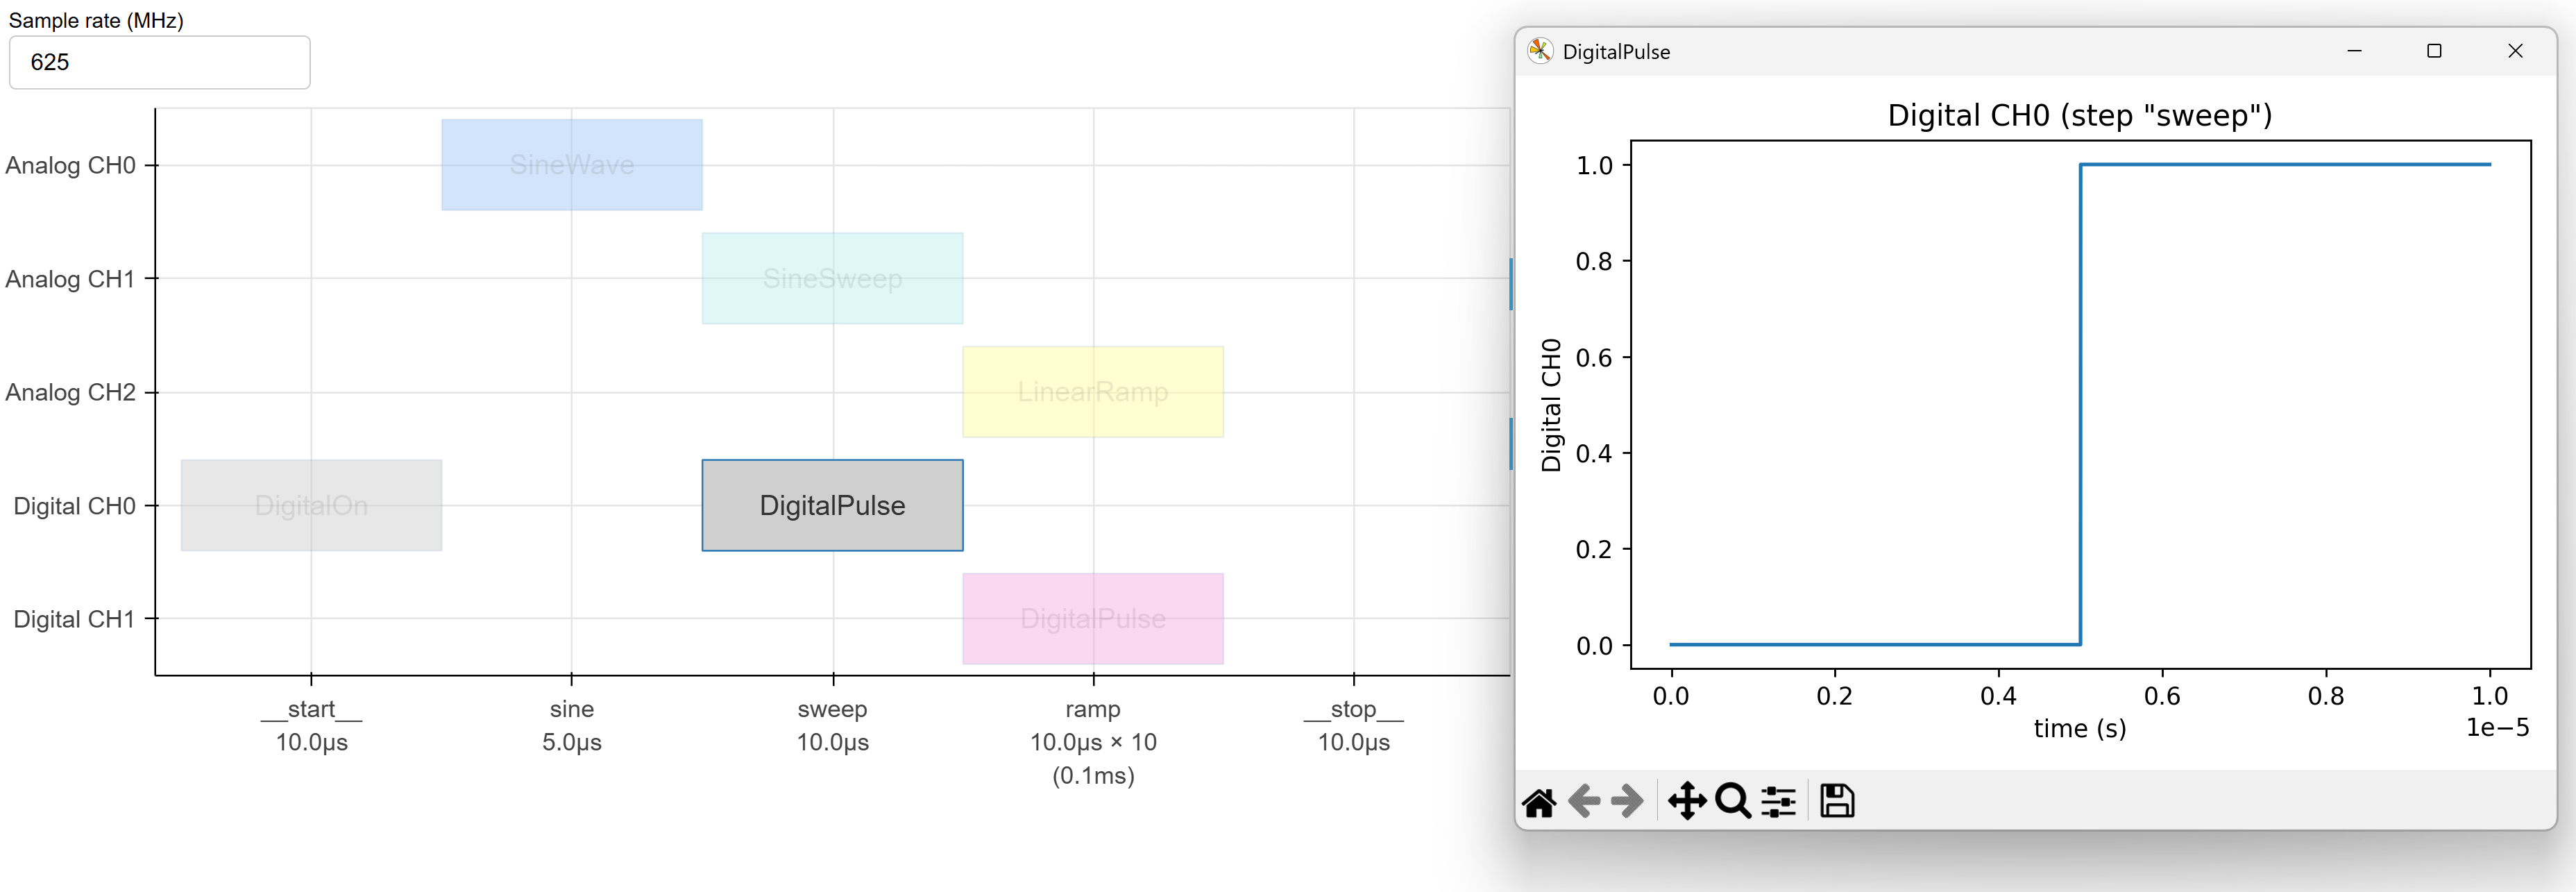
Clicking on a digital function shows its temporal trace too:
You can change the sample rate before clicking on a function. If the sample rate is too high it may take a long time to plot.
Clicking anywhere on the plot closes the active function plot window.
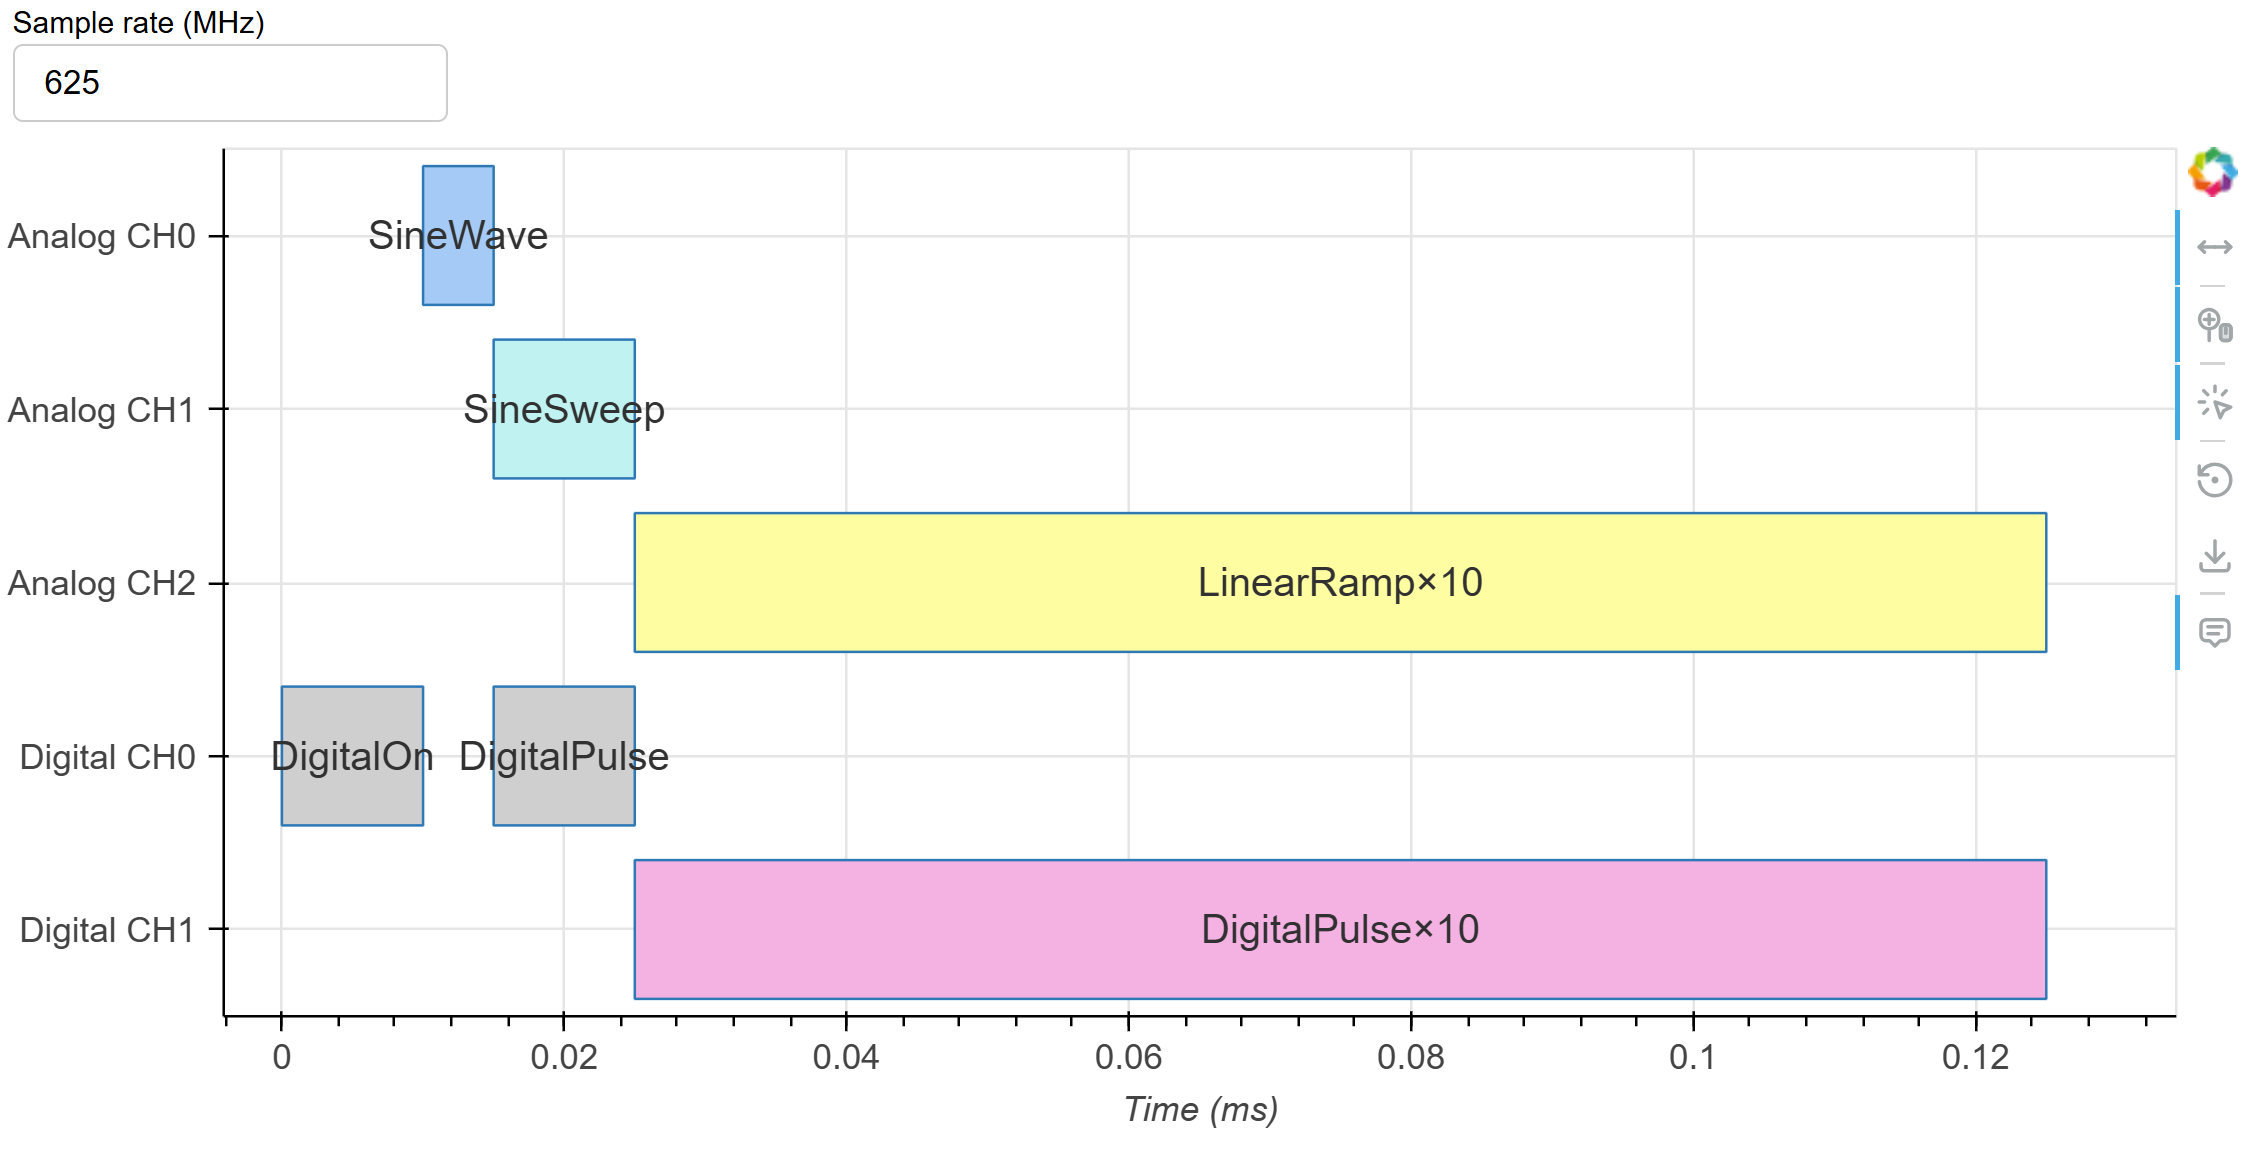
Timeline view
Use timeline_sequence() to view a sequence in the logic view,
where each step is depicted proportional to its duration.
from qfabric import timeline_sequence

timeline_sequence(sequence)
It shows the following plot. Clicking on function blocks shows its details, similar to the logic plot.